Content types on the ONS website Statistical articles
Overview
Statistical articles are the main content type on the ONS website for publishing commentary on our official statistics.
Statistical articles will replace bulletins and articles once Wagtail, the new content management system (CMS), is launched later in 2026.
When publishing in Florence (the current CMS), you must continue to draft content using the bulletin or article guidance. Keep any transformed content in draft form until Digital Publishing confirm the new CMS is live, and that you can publish it.
Statistical articles provide users with the latest figures and help them to:
- see what is new and what has changed
- get more detailed commentary or analysis
- understand how they can use the statistics, with links to more detailed information
Use for:
- official statistics
- a short summary of headline findings or trends, presented alongside the data
- more detailed commentary or analysis, presented alongside the data
Do not use for:
- detailed methodology or quality information; this should be included in your quality and methods guide
- interactive tools or calculators, sometimes known as evergreen content
- research that is not yet official statistics
- corporate content, such as progress updates or announcements about upcoming or recent work
Example
View an example of a statistical article (opens in a new tab)
Template
Download our statistical article template (opens in a new tab)
Please do not draft content for publication using this template until Digital Publishing confirm the new CMS is live and this content type is ready to use.
Writing and formatting requirements
All content should follow the ONS content style guide and writing for users guidance.
There are some additional considerations to think about when writing a statistical article.
Use a consistent structure
Most people visit the website to complete specific tasks. They look for information related to their task and, like all online users, scan the content instead of reading it top to bottom.
When people read a statistical article, they expect to see context and commentary, and to find their information quickly and without much work.
To support this behaviour, treat your article as a collection of shorter information sections with clear headings, rather than one long page. This will help people identify where they are.
The following structure reflects the user needs and priorities we have identified through research:
- Statistical title, optional narrative title, and summary
- Headline facts and figures (optional)
- Overview
- How to use these statistics (optional)
- Detailed analysis (optional sections) to provide more context on sub-topics
- Definitions
- Dataset links
- Data from other statistics producers (optional)
- Quality, methods and data sources
- Related links
You will find more detail on each of these sections further into this guide.
Focus on the top user needs
There is no maximum length for a page on the ONS website. However, according to user experience experts Neilsen and Norman Group, people typically only read 20% to 28% of a web page. This means most people will only read the first section. The quicker we tell the story, the better.
Think about the top three to five user needs for your topic when writing your article. This ensures you only include useful and relevant information.
The top user needs that every article must cover are:
- I need to understand the most important changes in the data (since the last release)
- I need to see how the data have changed over time
- I need to see if there’s a change in the quality of the data, which affects how I use it
- I need to understand the data in detail and get context where appropriate
- I need to download the data
- I need to know how the data were created
- I need to know how to cite this content and contact the team
To meet the needs of your users, section headings may be similar between editions but avoid copying and pasting entire sections. This leads to repetition and longer content over time.
The content design team can help you to identify the top user needs for your article or topic. Email content.design@ons.gov.uk (opens in a new tab)
Use charts and visuals to tell the story
Use visuals to help communicate the main findings and most important trends.
Lead with the chart and use written content to add context to your visuals and explain why the numbers have changed. Do not just repeat what the chart shows or say what has increased or decreased.
Read more about best practice for charts in the data visualisation section of the service manual.
Title and summary
Statistical title
All statistical articles need a statistical title. This describes the topic, geography and time period. Search engines use this statistical title, and it shows on the release calendar page ahead of publication.
Retail sales, Great Britain: November 2024
Baby names in England and Wales: 2024
Read more about general best practice in our titles and headings guidance.
Narrative title
A narrative title displays at the top of an article and describes the main findings. Use it in addition to the statistical title for articles aimed at inquiring citizens or information foragers.
Use narratives titles where the article:
- needs clear context or interpretation
- is routinely covered by the media or has significant public interest
- has a clear single narrative line or finding
Retail sales fell in October 2024 following poor clothing sales
Annual CPI inflation eases slightly in December 2024 after two monthly rises
Some crime returns to pre-pandemic levels in year ending June 2024
The narrative title must include the topic and time period. It must not exceed 80 characters and should ideally span no more than two lines. Include the geography and any other essential information in the summary.
Do not use a narrative title if there is no clear story to present, or where significant quality issues may lead to misinterpretation. In these cases, use only the statistical title.
If you need advice on when to use a narrative title, email digitalcontent@ons.gov.uk (opens in a new tab)
Summary
The page summary should add to the title and include any essential or important information that will help someone to understand what the article is about. It may also be used to generate and influence AI summaries.
Read more about best practice in our summaries guidance.
Headline facts and figures (optional)
Research shows that many users want to get the latest and most important figures as quickly as possible when coming to the ONS website.
To support this, you can include two or three headline facts and figures boxes at the top of the statistical article page. People should be able to understand these figures without reading more detailed commentary.
You must write these boxes as part of your article draft.
Example headline facts and figures for retail sales:
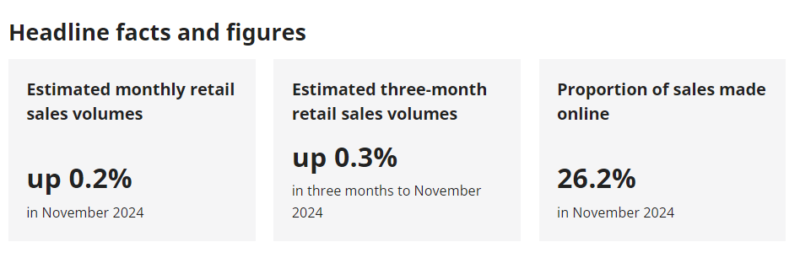
Each box must include:
- a short descriptive heading of no more than 45 characters
- a subheading with the geography covered (to be displayed on the topic page)
- the main figure; this can be a number, percentage or percentage change
- the time period covered and any essential context
This component is optional and is not suitable for all statistical articles. For example, you may wish to exclude it if more detailed context or quality information is needed alongside the figure to ensure its correct use.
If you would like support on whether headline facts and figures are suitable for your statistical article, email content.design@ons.gov.uk (opens in a new tab)
Headline facts and figures on the related topic page
We create headline facts and figures as part of the statistical article but can also display them on the related topic page.
You can select one or more of the boxes from a statistical article to display on the topic page.
Overview section
All statistical articles must start with an Overview section that focuses on the top one to three user needs for the topic. This section should:
- summarise the main story or trend
- provide clear context on why the numbers are changing
- use short paragraphs, subheadings and bulleted lists
- present any charts or visuals needed to support the prioritised user needs
- highlight one essential quality caveat, where applicable, using a warning panel
This section is intended for both expert and general users and should follow our plain language guidance.
The first paragraph of this section is likely to be used by AI software and chatbots to produce AI summaries. Frontloading the most important information will help to ensure that AI summaries are relevant to users and accurately reflect the content of your article.
Aim for fewer than 300 words for this section and a readability score of grade 8 or 9 to increase user engagement.
Warning (optional)
This highlights a quality caveat about the data or statistics at the end of the Overview section. Only include this if the information is essential for all users to correctly use the statistics.
For information about how to write this warning and when to use any further warnings in analysis sections, read our warnings guidance.
To clearly communicate multiple caveats that affect how information foragers and inquiring citizens interpret or use the data or statistics, include the optional How to use these statistics section.
Upcoming, potential and recent methods changes subsection (optional)
This subsection:
- gives users a summary of a change or potential change to methods, covering when the change will or did take effect, the type of change, and its impact
- helps users to decide whether they need to follow the link to more detailed information about the change
- gives users notice of any upcoming change to methods or trial of a potential change, allowing them to take any necessary advance action, and adheres to the Code of Practice for Statistics (opens in a new tab)
When to include the subsection
Only include this subsection when you need to tell users about:
- an upcoming change to methods
- a trial or test of a potential change to methods as part of development or improvement work
- a recent change to methods
For an agreed upcoming methods change, aim to include this subsection around:
- four weeks before the change for weekly releases
- three to six months before the change for monthly releases
- two editions before the change for quarterly releases
- one edition before the change for annual releases
For a potential methods change that we are trialling, when you include this subsection will depend on the context of the output and when it will maximise user feedback.
For a recent methods change, or if you become aware of the change post-publication, publish an update to the page to include this subsection.
Where to include the subsection
Include this optional subsection:
- at the end of the Overview section
- after the essential warning in your Overview section, if it has one
- and at the end of any Detailed analysis sections affected by the change
What to include
This subsection should include a standard subheading of:
- “Upcoming methods changes”
- “Potential methods changes”
- “Recent methods changes”
Then:
- use the following standard text, inserting the relevant information where prompted
- keep to a maximum of 30 to 60 words
- include a link to the relevant quality and methods guide for detailed information; do not include the detail here
Use the following standard text:
From [insert month or year], there will be a change OR we will test/trial a change OR there was a change to the [insert change type or types from those listed, and include the survey name if appropriate] that will [affect the [insert European Statistical System dimension(s) of quality] OR [insert specific description of impact] of [these statistics/the statistics on X subtopic/breakdown]. Read more in our [topic] quality and methods guide.
Choose one of the following change types:
- way we design the sample
- way we collect the data
- data we use to calculate the statistics
- way we process the data
- way we analyse the data
- way we produce the estimates
- way we publish the statistics
For impact types, either include one or more of the following nine European Statistical System dimensions of quality, or insert a more specific, but clear and concise description of the impact from the examples that follow or similar:
- relevance: for example, increase the number of groups for which we can produce estimates…
- accuracy: for example, reduce the bias in...
- reliability: for example, tend to reduce the size of revisions…
- timeliness: for example, bring forward the publication date…
- punctuality: for example, reduce the risk of having to postpone the publication…
- coherence: for example, improve the consistency of the patterns of these statistics with...
- comparability: for example, mean you cannot compare these with before...
- accessibility: for example, allow you to access the statistics automatically…
- clarity: for example, improve our explanations of changes over time…
Add a hyperlink to the Changes and their effect on comparability over time section (opens in a new tab) in your quality and methods guide. Give detailed information about the upcoming or recent methods change in the “Upcoming changes” or “Past changes” subsections.
Examples
Please note that these examples are for illustration purposes only, so do not necessarily reflect real changes.
Upcoming methods changes
From April 2026, there will be a change to the way we analyse the data that will improve the accuracy of the Index of Production. Read more in our Index of Production quality and methods guide (opens in a new tab) .
Potential methods change
From 2021, we will trial making more use of administrative data in our methods leading to more accurate and comparable migration statistics. Read more in our Migration quality and methods guide (opens in a new tab) .
Recent methods change
From 2009, we changed the way we produced the retail sales estimates that improved the accuracy of the retail sales value statistics. Read more in our Retail sales quality and methods guide (opens in a new tab) .
New and upcoming revisions subsection (optional)
We need to clearly inform users about any routine or unplanned revisions to our estimates. This helps users to:
- clearly identify which estimates will be revised in future and when
- navigate to dedicated revisions sections with updated estimates
- understand that revisions are a routine and necessary part of the statistical process
Include an optional subsection at the end of the Overview section, after the commentary and any warnings or upcoming methods changes subsections.
What to include
This subsection should include a standard subheading of either:
- “Upcoming revisions”
- “Recent and upcoming revisions”
It should include a short summary (aim for fewer than 50 words), explaining:
- whether the revisions are routine or unplanned and the reason or reasons for revision
- which data are being revised, particularly if the release includes multiple data sources
- the data period the revisions apply to
- when we plan to make the revisions (for upcoming revisions)
- any impact the revisions have or may have on the data
Always lead with the most recent revisions, if you need to tell users about recently made revisions and provide details on upcoming revisions.
Provide a summary of any recent revisions and signpost users to the dedicated “Revisions” section, which appears at the end of the detailed analysis sections, for more information.
When to include this subsection
Only include this subsection when you need to:
- tell users about upcoming revisions that are due to take place in an upcoming edition
- tell users about revisions made in this edition, alongside upcoming revisions in future editions
Aim to provide at least one edition’s notice of any upcoming revisions.
If your release only contains current revisions, only include the dedicated “Revisions” section (opens in a new tab) . Users can easily access this through the contents list.
Upcoming revisions
Reweighted estimates for the Labour Force Survey (LFS) will be incorporated into our next monthly release on 18 July 2025. This is a routine update to previously published statistics to improve coherence between sources. Read more in our article about the impact of the reweighting (opens in a new tab) .
How to use these statistics (optional)
This optional section helps information foragers, such as journalists, and inquiring citizens to quickly find and understand any quality caveats that affect how they can and cannot use the statistics. It is to prevent misuse and misinformation of our statistics.
This section:
- appears before any more detailed analysis
- uses a clear format of two bulleted lists, with icons to highlight the "cans" and "cannots"
- complements warnings and helps to limit their number and length
- signposts users to the Quality, methods and data sources section
Do:
- give users explicit instruction or meaningful advice on what they can or cannot do because of the quality caveat
- start each bullet with an active verb, such as “examine” or “compare”
- highlight caveats or limitations such as uncertainty around estimates shown by confidence intervals or changes to collection methods potentially causing short-term trends
Do not:
- say “treat with caution” as this can be vague
- include detailed quality and methods information in this section; include that in the supporting quality and methods guide
If any instructions are about comparability between data sources, this section can include an information panel before the bullets listing the data sources.
For support with writing this section, email content.design@ons.gov.uk (opens in a new tab)
Detailed analysis
Include additional analysis sections if users need more detailed context for specific sub-topics. Users can find more detailed breakdowns of the data in the datasets.
Do use detailed analysis for:
- sub-topics that are of interest for this edition
- highlighting important revisions to previously published statistics
- comparisons with other sources and time periods, where there is an interesting story to tell
Do not use detailed analysis for:
- highlighting every sub-topic or change in the data; more detailed breakdowns are available in the datasets
- repeating information about sub-topics that are no longer of interest for this edition
- presenting quality or methodology information, except for warning panels
Organise these sections in a clear and consistent way so people can easily scan and find what they need.
Group information by:
- sub-topics, for example, crime may include homicide, knife crime and burglaries
- geographies, for example, countries, regions and local authorities, following a logical order
- characteristics, such as age, sex, ethnicity
- comparisons, either over time, internationally or with other data sources
Each section should lead with the narrative, and follow a consistent pattern that helps users to:
- get the latest figures and trends
- understand what has changed and why
- access more detailed or supporting information
Use clear subheadings to break up the content and help people find what they are looking for.
Include information that is not essential for everyone to read within accordions.
View an example of detailed analysis sections that follow this guidance (opens in a new tab)
Revisions (optional section)
You can include a short revisions section, if appropriate, to highlight any significant data revisions that have been made in this edition and what impact they may have had on the statistics. This should appear as the last detailed analysis section.
If you need to inform users about upcoming revisions for future editions, include an optional subsection at the end of your Overview section (opens in a new tab)
Users can find more detailed information on revisions and the methodology behind them in the associated Quality and methods guide
Do use a revisions section to:
- give a brief explanation of any significant revisions that have taken place since the last edition or the previous revisions period
- provide any essential updated figures, either using bullet points or a clear chart or table, and any explanation of how these differ from previous figures
- summarise the wider impact and context of the revisions on the statistics
View the England and Wales population release for an example (opens in a new tab)
Do not use a revisions section to:
- highlight upcoming revisions that do not affect this edition of the article
- provide detailed information about the reasons for or methods behind the revisions – include this in the related quality and methods guide instead or link to your topic’s revisions policy
- list every single data revision or change – include this in the dataset instead
Organise the section in a clear and consistent way so people can easily scan and find what they need.
Use clear subheadings for essential information that all users need to understand. Use accordions to break down information that is not essential for all users into specific subcategories so that users can find the detail they need.
Definitions
Clear definitions help users to understand what the statistics cover. Use a dedicated section with an accordion for each term to help users find the definition they need. Aim for up to six of the most important definitions.
Definitions are added through a central ONS glossary in the CMS and reused across multiple articles. This is to ensure consistency across our content.
If you need to add a new term to the glossary, or update an existing term, email content.design@ons.gov.uk (opens in a new tab)
Dataset links
Include up to six links to the most useful and relevant datasets used to produce your statistical article. Use clear subheadings to group related dataset links, if appropriate.
The format of this section is automated within the CMS to display the page title and link, release date, content type and page summary.
Data from other statistics producers (optional section)
The purpose of this section is to give a coherent picture of available statistics on this topic. You can include this optional section if our users need to:
- know what data are available from other statistics producers
- know if they can compare or combine them with ONS data and, if so, to what extent
- easily navigate to them
Other statistics producers can be national statistics institutes in Wales, Scotland or Northern Ireland, other government departments or private statistics producers.
We use a clear and consistent table format for this section to:
- list what data are available and link to them
- give the name of the statistics producer
- show a rating of “highly”, “broadly” or “not” comparable for each source
- signpost to the quality and methods guide to find out why we have given these ratings
For support with this writing this section, email content.design@ons.gov.uk (opens in a new tab)
Quality, methods and data sources
The purpose of this section is to provide clear and consistent links to relevant supporting information about the quality and methods information for the statistics and data sources. It is also to give information about the accreditation status of the statistics.
Research shows that users prefer clearly defined pages, with clear user journeys between them. Statistical articles are designed to provide analysis and context and should not contain detailed quality and methodology information.
Include this information in your supporting quality and methods guide and data sources guide and link users directly to it using the following subsections:
- About the statistics
- About the data sources
- Statistical designation, where applicable
About the statistics subsection
Use the related links format to direct users to the quality and methods guide (previously called the QMI). This includes the title, summary, last revised date, content type and link. You can also link to one-off methods publications about the data
About the data sources subsection
Use the related links format to direct users to the data sources guide or guides. This includes the title, summary, last revised date, content type and link. You can also link to one-off methods publications about the statistics.
Statistical designation subsection
This subsection provides users with a short statement about the official designation of the statistics.
Use the standard wording agreed with the Office for Statistics Regulation (OSR) and the Statistics Head of Profession Office, available in our Statistical designation guidance
Read more about statistical designations on the OSR’s website:
- accredited official statistics (opens in a new tab)
- official statistics in development (opens in a new tab)
Related links
Include up to six links to relevant, timely and useful pages within the ONS website that are not linked elsewhere in the content.
The format of this section is automated within the CMS to display the page title and link, release date, content type and page summary.
Moving Data sources and quality section content
Bulletins and articles include a Data sources and quality section. This provides a summary of the quality and methods information.
This section will be replaced by a new Quality, methods and data sources section when you move to the new statistical article template. It follows a standard format that helps users to quickly access the relevant quality and methods publications. Read more in our Quality, methods and data sources section guidance (opens in a new tab)
Any text currently included in your bulletin or article’s Data sources and quality section must be moved to a relevant methodology publication before you publish your first transformed statistical article.
Where to move Data sources and quality section content
When you publish a transformed statistical article
When you publish your first transformed statistical article, move the content from the bulletin or article’s Data sources and quality section to either:
- an existing quality and methodology information (QMI) report
- an alternative methodology publication if more relevant
Add the content as:
- an Overview section at the top of the methodology publication
- An alternative section if more relevant
Link to the methodology publication in your statistical article’s Quality, methods and data sources section, using the standard format.
When you publish a transformed quality and methods guide
Quality and methods guides will replace quality and methodology information (QMI) reports, user guides and methodology guides as part of our exciting web and content transformation programme.
Existing QMI reports, user guides, and methodology guides will be archived to the UK Government Web Archives when a replacement quality and methods guide is published.
Include the content from a bulletin or article’s Data sources and quality section in a transformed quality and methods guide.
Include important takeaways that all users need to know in the Overview section. Include less essential information further down the page in relevant sections.
Read more in our Quality and methods guide guidance when it's available.