For designers Diagram design
Overview
Diagrams can help support written content and make it more understandable. Although they can be a useful illustrative tool, always consider whether the user need can be met with clearly written text before using a diagram.
All diagrams that are published on the Office for National Statistics (ONS) website are created by our design team, after discussing the user need with a content designer. Further guidance on when to include diagrams in your content is available in our content style guide (opens in a new tab)
For diagrams to be published elsewhere, email ons.design@ons.gov.uk (opens in a new tab)
Diagram design principles
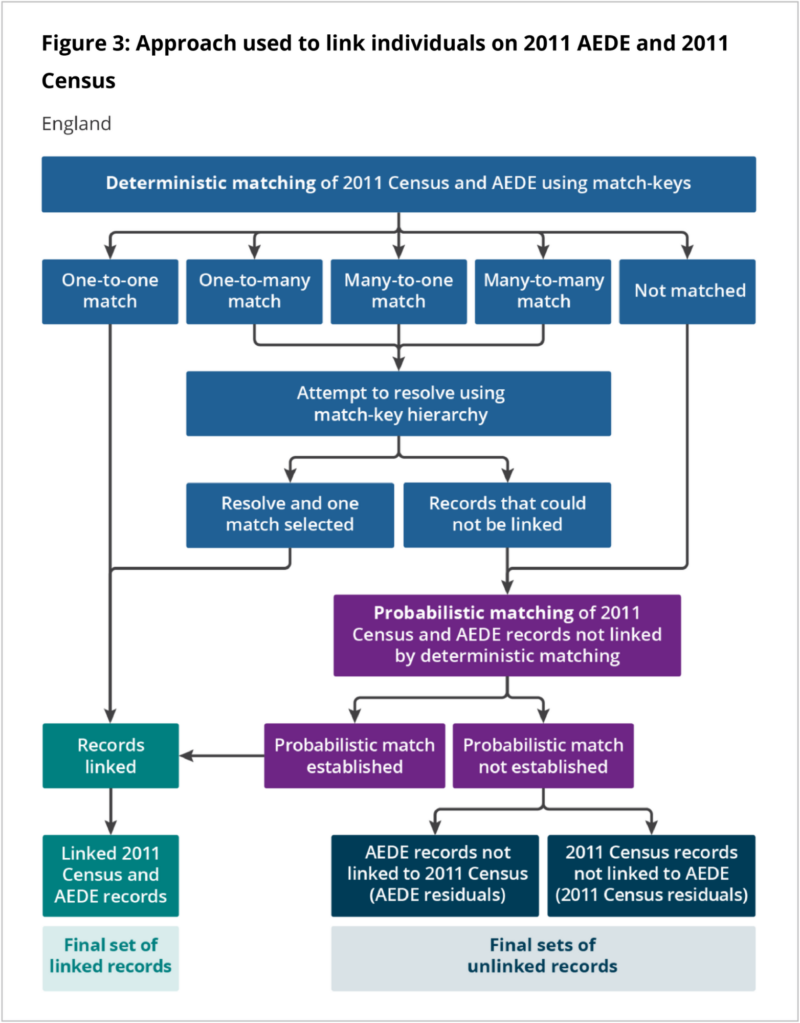
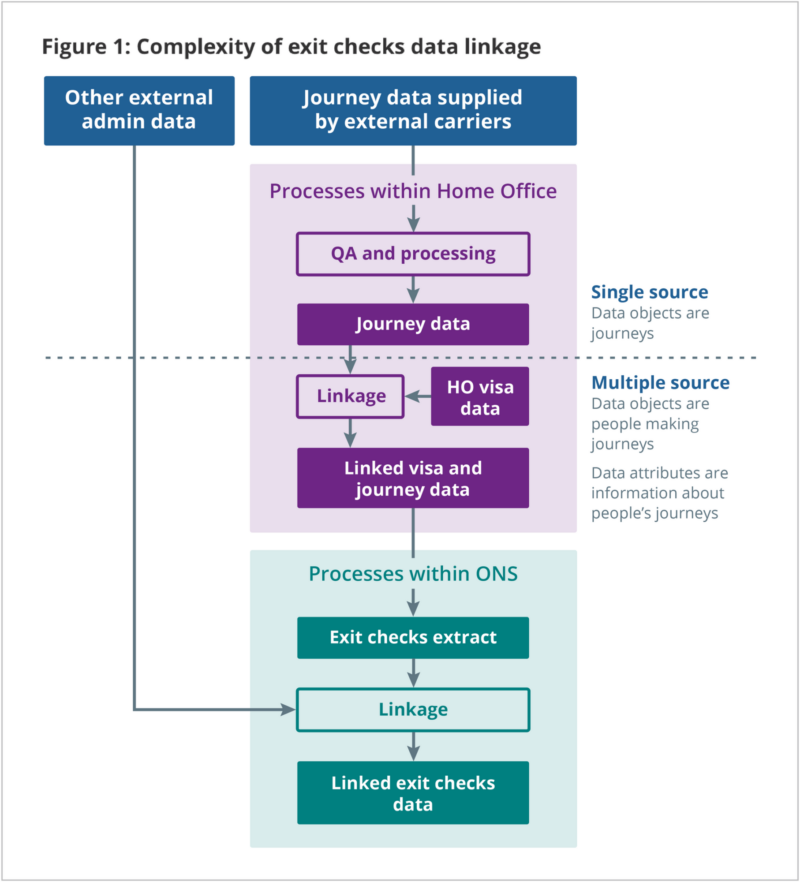
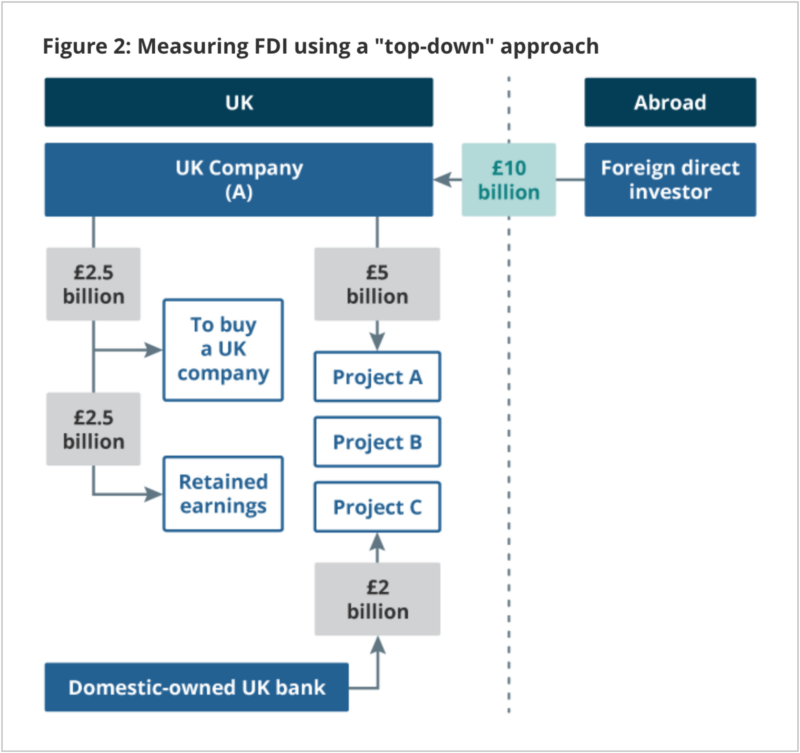
Flowcharts, process maps and illustrations should:
- be clear and easy to understand
- follow normal reading direction, from left to right and top to bottom
- use simple shapes and as few different shapes as possible
- have a clear starting point
- not have overlapping lines
- not rely on colour alone to convey meaning
The information should also be provided in an accessible format, such as a clear text description.
Designing diagrams
All diagrams should be designed using the ONS brand colours.
Text should be a minimum of 16-point (pt) font size, but ideally 18pt if space allows.
For flowcharts containing basic shapes and lines, internal ONS colleagues can download our diagram template from Confluence (opens in a new tab)
To request a more responsive Figma template, email ons.design@ons.gov.uk (opens in a new tab)
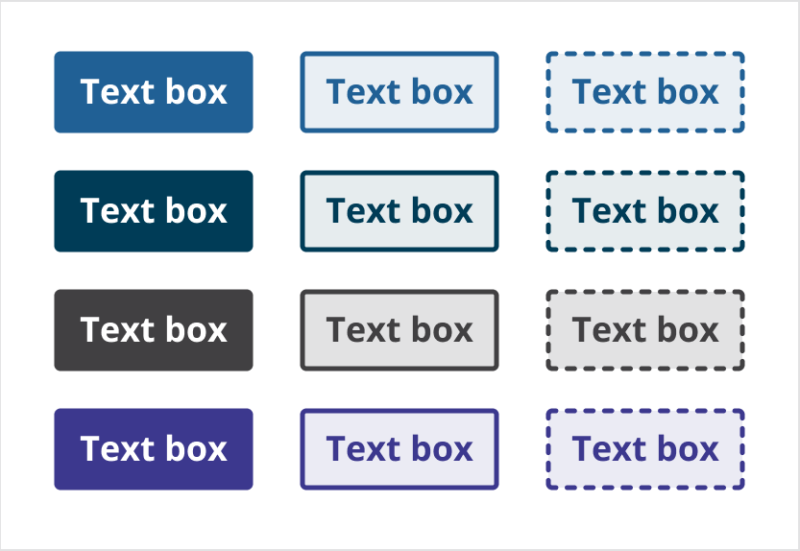
Text boxes
Boxes should use:
- 18 pixel (px) bold font size as default, with minimum 16px
- Padding 8px, 12px, 10px, 12px
- 2px corner radius
- 2.5px stroke width
- (if dashed) 4px dash, 6px gap and rounded cap
- 10% tint background colour
Arrows and lines
Arrows and lines should use:
- 2.5px stroke width
- (if dashed) 4px dash, 6px gap and rounded cap
- Adobe Illustrator Arrow 5 arrowhead, scale 75% or Figma triangle arrow
- 5px corner radius for line corners
- Default colour Grey 75
Flowchart symbols
Flowcharts can use special shapes to represent different types of actions or steps in a process.
There is further guidance on how to use shapes in flowcharts on the SmartDraw website (opens in a new tab)
Output type
Diagrams for web pages should be exported as an SVG file, to scale for different browser sizes and so that text can be read by screen readers. There is further guidance available on how to create an accessible SVG file on the CSS tricks website (opens in a new tab)
We currently publish all images as PNG on the ONS website due to CMS constraints. Our goal is to move towards the more accessible SVG format in the future.
Help improve this page
Let us know how we could improve this page, or share your user research findings. Discuss this page on GitHub (opens in a new tab)