Example Line Chart
Sales volumes and values saw moderate growth in July 2024
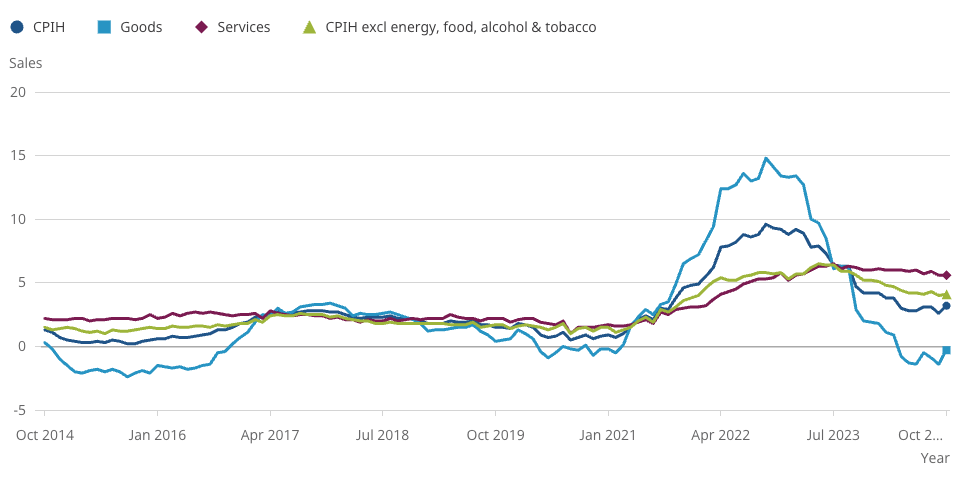
Figure 6: Upward contribution from housing and household services (including energy) saw the annual CPIH inflation rate rise
Line chart showing the annual rate of inflation for the Consumer Prices Index including owner occupiers’ housing costs (CPIH) and its components.
Use the Tab key to move focus into the chart. Once inside, use the arrow keys to navigate between data points. As you move, tooltips will be announced to describe each point. Touch device users, explore by touch or with swipe gestures.
Download Figure 1 data
Footnotes
- Non-store retailing refers to retailers that do not have a store presence. While the majority is made up of online retailers, it also includes other retailers, such as stalls and markets.
- More data are available in our Retail Sales Index datasets.